INSECT (IN-silico SEarch for Co-occurring Transcription factors) is a user-friendly tool to predict the occurrence of Cis Regulatory Modules (CRMs), which control gene expression. INSECT allows a complete and flexible analysis of the predicted co-regulating Transcription Factors (TFs) and Transcription Factor Binding Sites (TFBSs). The tool combines several CRM identification strategies by applying different search schemes and restriction parameters on TFs, TFBSs and genome sequences. CRMs search is performed by using Positional Weight Matrices (PWM), which are publicly available in TRANSFAC, JASPAR, UniPROBE, SwissRegulon, Hocomoco and FlyFactorSurvey databases, or by constructing PWMs from known target sequences. INSECT integrates many different search options and additional results such as automatic regulatory sequences retrieval from Ensembl, phylogenetic footprinting, nucleosome occupancy calculations, and gene ontology information. INSECT output includes identified CRM site location graphics and statistics on potential TFs positions and PWM Scores. CRMs site information can be uploaded to UCSC Genome Browser as GFF file tracks to be compared and integrated with other relevant genomic information such as data from the ENCODE project. The simple and intuitive interface along with its search flexibility and data integration makes INSECT an easy and powerful tool for scientists requiring search and analysis capabilities for potential CRM presence at a genomic scale.
Citation
If you find INSECT 2.0 useful for your work, please cite us:
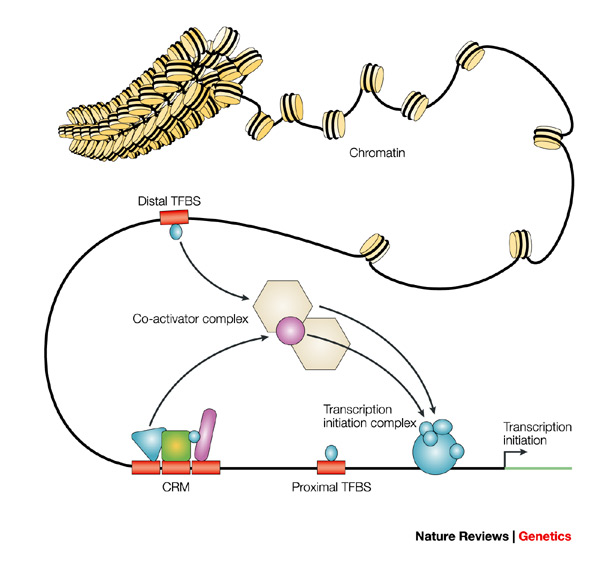
The rate of transcription of genetic information from DNA to mRNA is controlled by transcription factors proteins that bind to specific DNA sequences named transcription factor binding sites. These proteins perform their regulatory function alone or with other proteins in a complex, by promoting (as an activator), or blocking (as a repressor) the recruitment of RNA polymerase to specific genes. Some transcription factors interactions tend to co-localize at specific DNA regions, usually 100-1000 DNA base pairs in length, named Cis-regulatory modules.
Figure 1. Transcription factors bind to specific DNA regions named transcription factor binding sites. Sets of TFs can interact conforming Cis-regulatory modules. Nat Rev Genet, Vol. 5, No. 4. (01 April 2004), pp. 276-287.
In single organism searches: whole-genome, lists of genes or fasta sequences are analysed for the presence of TFBSs of interest which conform a potential CRM (see Search section to see the methodology).
Phylogenetic footprinting is a technique used to identify transcription factor binding sites (TFBS) within a non-coding region of DNA of interest by comparing it to the orthologous sequence in different species. INSECT uses this technique to lower the false positives rate in TFBS searches. For every potential CRM identified in a gene, the INSECT search algorithm requires the orthologous gene sequence to have an equivalent CRM. A CRM is considered equivalent in a pair of orthologous genes if the TFBS positions relative to the gene Transcription Start Site (TSS) are conserved within a range defined by the user (by default it is set to 1000 bp). Users are encouraged to carefully apply this option as it has been shown that between human and mouse ~50% of regulatory elements are conserved. It has been also postulated that most of the genome conserved sites are those of high binding specificity. Note that filtering out a specific site by applying phylogenetic footprinting does not necessarily mean that it is a false positive; instead, it means that the other remaining sites have more chances to be true positives due to a high conservation.
CRMs are defined by a set of TFBS and specific relations among them. The INSECT web server allows users to perform two different TFBS searching methods.
In the sliding window method, the genome or target sequences are scanned using a fixed length sliding window defined by the user. As the windows slides the analysed subsequences must contain matches to all the selected TFs in order to report a potential CRM. Additionally, users can set some of the TFs not be necessarily present to report a valid CRM by checking the “Allow missing” option located in the “Transcription Factors and TFBSs” section alongside the selected TFs.
In the master driven method a master transcription factor must be selected to drive the search of the co-occurring factors, which are restricted to be located at a user defined spacing relative to the master. This method is more restrictive than the sliding window search as it requires the different TFs to strictly satisfy the imposed restrictions in relation to a reference master TFBS. A maximum of 5 TFBSs can be search in this mode, including the master.
Note: For both search options TFBSs can be searched either in the direct, reverse or both strand orientations. This is an important feature as usually TFBSs co-localize in very specific manners when binding to DNA as a consequence of their physical interaction at their quaternary structure.
INSECT allows automatic sequence retrieval from a group of fourteen genomes that are deposited in the Ensembl genome database (www.ensembl.org). These genomes were downloaded to our INSECT server, and were updated to their last version according to the Ensembl 2015 release.
Two different types of IDs are accepted for automatic sequence retrieval: Gene Symbols (e.g. BRCA2) or Ensembl Gene IDs (e.g. ENSG00000139618). These IDs can be typed in a text area, separated by carriage returns.
INSECT allows performing CRM searches in whole genomes for the fourteen Ensembl genomes available in our database. By using this option, INSECT will automatically search all the annotated genes from Ensembl for the selected genome.
Note on gene filters: Some researchers might be interested to analyse specific subsets of genes from the genome, i.e. a specific chromosome or genes from a given biotype. INSECT allows the user to apply different input data filters to reduce the analysis to the specified genomic elements, which will help to reduce the search space and save time to focus on the dataset of interest.
Users can upload their own set of sequences to perform the CRM search. These sequences must be stored in a multi-fasta file properly formatted. Follow the link to see a valid Multi-Fasta file format.
The automatic sequence retrieval requires the users to provide a valid list of Gene IDs and the upstream and downstream distance limit of the putative regulatory regions relative to the transcription start site. Taking these distances into account INSECT retrieves the sequences to analyse for the whole gene list.
In phylogenetic footprinting analysis a potential CRMs need to be conserved in both species. The CRM must be located within a certain window size when comparing positions relative to the corresponding TSS of each specie (e.g. if the conservation window size is of 2000 bp, and there is a CRM located 1500 bp upstream from the reference gene, the CRM must be found in-between the positions 500 bp and 2500 bp upstream in the orthologous sequence in order to constitute a valid site).
A position weight matrix (PWM), also called position-specific weight matrix (PSWM) or position-specific scoring matrix (PSSM), is a commonly used representation of motifs (patterns) in biological sequences. A PWM is a matrix of score values that gives a weighted match to any given substring of a fixed length within a sequence. It has one row for each symbol of the alphabet, and one column for each position in the pattern. PWMs representing different transcription factor binding sites (TFBSs) can be selected from the INSECT local database where JASPAR (JASPAR_CORE), TRANSFAC Release 7.0 (Public), UniPROBE, SwissRegulon, Hocomoco and FlyFactorSurvey PWMs are integrated. Alternatively users can upload their own PWMs or create them from an ungapped multiple sequence alignment (msa).
PWM calculation from a msa:
From a set S of n aligned sequences of length
l, s1, ... , sn, where sk = sk1, ... , skl (the skj being one of {A, C, G, T}) a Position Weight Matrix, M4xl is derived as \( M_{ij} = _{n}^{1}\sum_{k=1}^{n} I_{i} (s_{kj}) \) where \( i = A,C,G,T \) and \( j=1,...,l \)
where \( I_{i}(q) = \left\{\begin{matrix} 1\ if \ i=q\\ 0 \ otherwise \end{matrix}\right. \)
Each coefficient in this matrix indicates the number of times that a given nucleotide has been observed at a given position. The coefficients in a Position Weight Matrix are directly computed as log-likelyhood values according with the following transformation log(
Mij/pi), where Mij is the probability of nucleotide i at position j in the Matrix
M, and pi is the background probability of nucleotide i. The background probability of nucleotide can be assumed to be an 'a priory' probability, the frequency of the nucleotide in the whole sequences use to derive the matrix, or the frequency in the aligned region from where the matrix is actually derived. Then, given a sequence of length l above log-likelihood ratio can be computed by adding the coefficients of the log-likelihood matrix corresponding to each nucleotide in each position on the sequence.
The score assigned by a PWM \( m \) to a substring \( S=(S{j})_{j=1}^{N} \) is defined as \( \sum_{j=1}^{N} m_{s_{j},j} \), where \( j \) represents position in the substring, \( s_{j} \) is the symbol at position \( j \) in the substring, and \( m_{\alpha ,j} \) is the score in row \( \alpha \), column \( j \) of the matrix. PWM scores are calculated as the sum of position-specific scores for each symbol in a given substring. We assume a direct association between the DNA sequence variability in the binding sites and the binding affinity (or activity) for the particular protein that recognizes these sites. In this context, if enough number of sequences were employed to build the PWM, higher TF binding affinities would be indicated by higher PWM scores, being the maximum matrix score, \( MMSc = \sum_{j=1}^{N} max(m_{j}) \). Substrings will have PWM scores no greater than its MMSc. The score of every substring is divided by the MMSc in order to normalize the TF affinities and provide a score that is comparable among different factors without a length motif bias.
TFBSs search using a PWM requires defining a score threshold in order to determine if a sequence is defined as a potential TFBS or a false positive. The threshold value is expressed as a percentage. A low score threshold usually leads to the appearance of spurious matches, making the prediction of potential TFBSs difficult due to a high False Positive Rate (FPR). Therefore, users need to define and set an optimal threshold for each search.
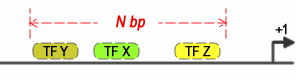
This is the size of the window where the co-occurring factors are supposed to be located. The algorithm works by sliding a window along the target sequence and checking for the presence of every TF that was added to the search.
Figure 2. Sliding window search for three co-occurring TFBSs with spacing restriction set by a window size of N bp.
This parameter sets the allowed relative orientations among all the selected TFs. INSECT offers three possible options:
1. Cis, all TFBSs have direct orientation: Restricts all the TFBSs to be positioned in the same strand in direct orientation.
2. Same orientation for all TFBSs in a CRM: Restricts all the TFBSs that belong to a CRM to be in the same strand. Note that TFBSs belonging to different CRMs can be localized in different strands.
3. Any orientation: Allows the TFBSs to be positioned in any DNA strand (TFBSs in a CRM can be placed in different strands).
INSECT will search and report all the TFBSs for the selected PWMs in the analysed sequence. This means that every site with a upper threshold than the selected cut-off will be reported.
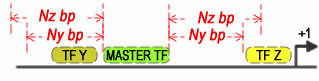
Define the maximum distance between co-occurring TFs and the Master TF when the "Master driven search" is selected in order to define a CRM as positive. If the master is located upstream, the maximum spacing is considered from the end of the co-occurring transcription factor to the start of the Master transcription factor. If the Master transcription factor is located downstream, then the max spacing is considered from the start of the Master transcription factor to the start of the co-occurring transcription factor.
Figure 3. Master driven search for a Master TF and two co-occurring TFs with different maximum spacing restrictions.
Users can restore a previous saved TFs and search parameters configuration. A valid parameters ID number must be entered in the input box in order to load a saved search configuration.
The selected TFs and search parameters for them (all the configurations in the Transcription Factors and TFBSs section), are saved in a webserver database to be available in future sessions. User receives a parameters ID number, which must be saved.
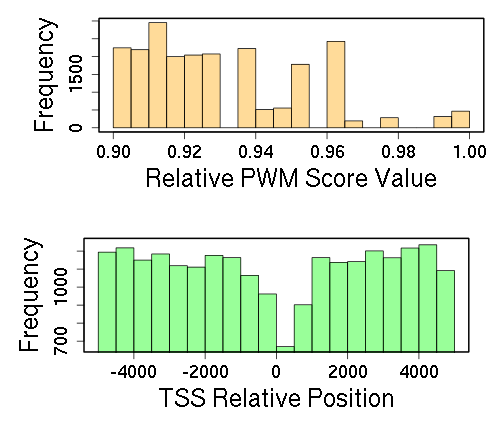
INSECT creates a results page showing an overview table with all the identified genes containing at least one CRM. The distributions of TFs PWM Scores and TSS relative positions for all identified CRMs are shown as histograms. These figures are useful to show how restrictive or flexible are the obtained PWM scores, but also show if there is a trend in how the occurrences of the TFBSs are distributed within the CRM selected range. A word cloud made of all the Gene Otology terms associated to the identified genes is also included in the overview.
Figure 4. Histograms showing the distributions for Relative PWM Score Values of the different TFs (above), and TSS Relative Distances of the different CRMs (below).
The overview table has the following information:
First column: Gene Name.
Second column: Ensembl Gene ID.
Third column: Chromosome number to which the gene belongs.
Fourth column: Ensembl biotype, e.g protein_coding, pseudogene, SnoRNA among others. The different types can be seen at this page: http://www.Ensembl.org/Help/Glossary?id=275.
Fifth column: Description of the gene.
Sixth column: Best CRM Score. In order to calculate this, the average value for all the TFBSs composing each CRM is calculated and the highest scoring value is shown.
Seventh column: Average CRMs Score. In orter to calculate this, the average value for all the TFBSs composing each CRM is calculated and then all those values are averaged again.
Eighth column: Redirects to the details page for the selected gene.
Figure 5. Overview table of positive genes with potential CRMs.
When using the automatic sequence retrieval from the Ensembl gemomes, filters on chromosomes and Ensembl gene biotypes will be activated. These filters allow updating the result gene list to visualize those genes that satisfy the selected options. Also a threshold filter is implemented which allows users to filter those CRMs having at least one TFBSs with a TFBS Score below a threshold (note: The threshold to filter must be higher than the threshold used to run the job).
Figure 6. Filters implemented in INSECT to better dissect positive results at genome-wide analysis.
Filters Note:
When applying the Treshold filter, it is applied over each TFBSs composing the CRMs. Histogram of PWM scores for all the selected TFBSs are shown.
Table with the information about the TFBSs detected. GFF3 formatted file can be downloaded.
First column: ID of the analysed sequence.
Second column: Transcription factor name.
Third column: Sequence corresponding to a potential TFBS.
Fourth column: TFBSs start position relative to the TSS.
Fifth column: TFBSs end position relative to the TSS.
Sixth column: Absolute PWM score (strongly correlates with the motif length).
Seventh column: Relative PWM Score. Relate to the maximum score that can be computed on the PWM. Value between 0 and 1.
Eighth column: (+) means the TFBS is in the same sense as the gene transcription. (-) means the TFBS is antisense with the gene transcription direction.
Ninth column: Display a N bases pair region surrounding the detected TFBS.
Tenth column: Nucleosome occupancy probability for each position of the predicted TFBSs, calculated using a local version of the software developed at (http://genie.weizmann.ac.il/software/nucleo_prediction.html).
Eleventh column: Average nucleosome occupancy for all the nucleotides composing the TFBS.
If a given gene is associated with too many Gene Ontology terms, it is hard to make sense of them by looking at the GO Table. Wordclouds constitute a good tool to graphically summarize this type of information. INSECT creates a wordcloud from the words in the different Gene Ontology Terms descriptions for a given gene or for a list of all identified genes. Figure 8 shows a wordcloud made from the Gene Ontology terms descriptions mapped for the Sox2 gene. It is possible to observe how the "transcription", "regulation", "differentiation" and "development" terms are evidently enriched among the GO terms which are indeed the most important roles for the Sox2 gene.
Eukaryotic genomes are packaged into nucleosome particles that occlude the DNA from interacting with most DNA binding proteins. Nucleosomes have higher affinity for particular DNA sequences, reflecting the ability of the sequence to bend sharply, as required by the nucleosome structure. We applied a nucleosome–DNA interaction model developed by Kaplan et al. Nature, 2006 to predict the genome-wide organization of nucleosomes. This model calculates the probability of a base for being occupied by a nucleosome, giving a value between 0 and 1 for low and high probability occupancy, respectively.
The UCSC Genome Browser website provides a rapid and reliable display of any requested portion of genomes at any scale, together with dozens of aligned annotation tracks (known genes, predicted genes, ESTs, mRNAs, CpG islands, assembly gaps and coverage, chromosomal bands, mouse homologies, and more). Half of the annotation tracks are computed at UCSC from publicly available sequence data. The remaining tracks are provided by collaborators worldwide. Users can also add their own custom tracks to the browser for educational or research purposes. INSECT allows the user to display the results as custom tracks automatically uploaded to the browser, allowing rapid visualization of the results together with the pre-computed tracks at the UCSC Genome Browser.
Figure 11. INSECT results displayed as a UCSC Genome Browser track.
INSECT allows linking a list of identified genes with CRM to be analysed with GeneMANIA for nine of the available genomes. By checking the genes of interest and submitting to GeneMANIA, users are able to find other functional associated genes. GeneMANIA association data includes protein and genetic interactions, pathways, co-expression, co-localization and protein domain similarity.
Ensembl has recently released a new feature that aims to annotate regulatory elements in human and mouse genomes by merging both, experimental and computational derived data. The Ensembl Regulatory Build includes data from the ENCODE and The NIH Roadmap Epigenomics project, See Ensembl Regulation overview.
INSECT links the results for each identified gene with CRMs to Ensembl Regulatory Build in order to provide users access to this innovatory tool when analysing data from human or mouse.
Further reading.